There are numerous indicators capturing the overall market-breadth such as Advance-Decline, New 52-high/low, % of stocks above a particular moving average to name a few. While these are popular among the breed, I wanted to discuss something which is not so popular but quite effective one: Bullish Percent Index.
This index was popularized (as far as I am aware) by Thomas Dorsey of www.DorseyWright.com. The index captures the percentage of stocks which are in a buy-mode based on the Point & Figure chart. The beauty of Point and Figure chart is that, any given stock or instrument will always be either in a buy or a sell mode, depending on the most recent signal triggered. There is no room for confusion here !
So, the Bullish Percent Index is nothing but the percentage of stocks that are in a buy-mode in the Point & Figure Chart. This percentage is plotted as a Point & Figure chart with a typical 2-points X 3-box reversal criteria. In order to decide if a stock is in a buy or sell mode, I have used 1% box size and a 3-box reversal. Based on this, the Bullish Percent Index is calculated and featured below.
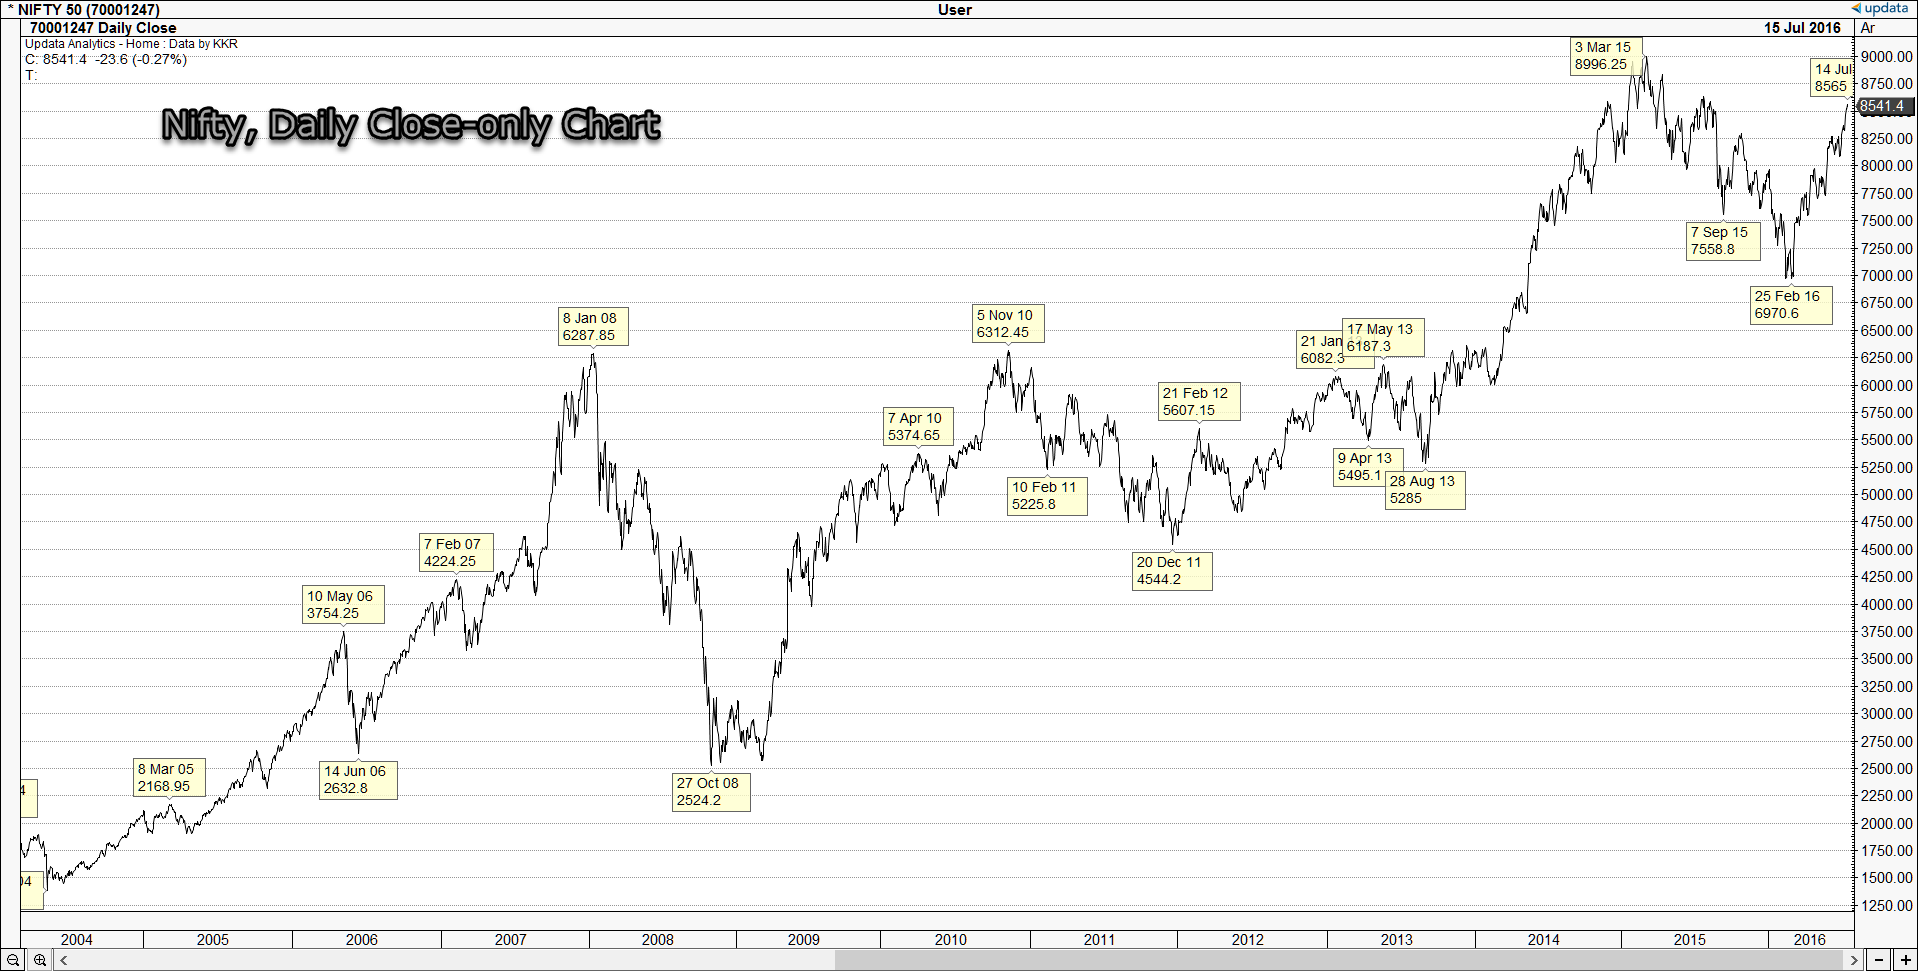

Notice how the extremes of the turns in the Nifty are captured by corresponding extreme reading and sell-signal in the Bullish Percent Index chart.
How does one interpret the chart?
Any reading above 70 is traditionally considered overbought and below 30 is oversold. Let’s understand the logic here. A reading of 70 indicates that 70% of the stocks are in a buy-mode. When 70% of the stocks are in a buy-mode the scope for further demand to sustain the rally and move to higher levels would be diminished to a large extent. But, any reading above 70% does not necessarily mean market has topped out and it is time to sell. One has to wait for a sell signal at the upper extreme or a buy signal in the lower extreme in the Bullish Percent Index chart to indicate that a reversal or at least a sizeable counter-trend correction is round the corner.
For the sake of clarity, a buy signal in the Point & Figure chart is triggered when a column of “X” moves above the high of the immediately preceding column of “X”. Similarly, a sell signal is triggered when a column of “O” falls below the low of the immediately preceding column of “O”.
If you look at the chart above, the index is now at little over 84 which means that about 84% of the stocks traded at the NSE is in a buy mode. This means the index is well into the overbought territory. But, a sell-signal has not been triggered. So, one needs to be careful and play “defensively” and not get aggressively long. This is the message conveyed by the Bullish Percent Index chart.
Notice how the indicator was in the overbought territory ahead of the Brexit event and cautioned us not to buy aggressively. There was a sell-signal in the chart but that got reversed quickly even before the index could drop below the half-way or the 50% mark.
Also look at how this index behaved ahead of the 2008-crash. It was well past the 70-mark in December 2007 and after the sell signal was triggered, it was a whitewash. The point is one does not know how serious a reversal off the 70-mark would be in terms of price damage. So, it always pays to be cautious and load up on long position when the index reverses off the oversold region.
Let’s wait and watch how relevant the current cautionary-signal turns out to be.
I have used the charting software from www.updata.co.uk for the Bullish Percent Index chart. I am not aware of any other software which offers this facility. If anyone is aware of other charting platform offering this feature, please mention it in the “comments’ section below.
I am also not aware of any site that publishes or features this chart for Indian markets. Again, please do educate us of such sites if anyone is aware. Share the website url in the comments section.
The popular site www.stockcharts.com offers Bullish Percent Index for US stocks but not for Indian ones. Hope they provide this soon.
This post is by no means an exhaustive literature on the subject. The purpose of this post is to initiate readers to this wonderful tool. I would instead like to direct you to checkout articles at www.stockcharts.com and the book on Point & Figure charting authored by Thomas Dorsey. Also checkout the site www.DorseyWright.com for additional literature on the subject.
Comments 4
Great article thanks for sharing your knowledge
I think @Prashantshah is dealing with p&f theory and has software plotting such charts.
_Nalin Gandhi
Author
Hello Nalin:
I am using TradePoint software developed by http://www.Definedge.com. It is a wonderful software and Prashant is a good friend of mine. The software does not have facility to plot Bullish Percent Index but has Bullish X Percent which is a variant. I have given my inputs to Prashant and he has promised to incorporate them as soon as possible.
Thanks for writing and good luck!
B.Krishnakumar
A great piece shared with all of us. Thank you .